
Hello Folks, We're going to look closely at Azure's monitoring tools, focusing on moving from the Log Analytics agents to Azure Monitor Agent (AMA). This is the first step in our journey. We'll learn how to find and check the monitoring agents using KQL to help us identify the agents we need to migrate.
As Microsoft announced the retirement of the Log Analytics agent on August 31, 2024, it's imperative to gear up for what lies ahead. Post-retirement, utilizing the MMA or OMS agent could lead to certain expectations and operational shifts that we need to be prepared for.
🕐 The Clock is Ticking for MMA and OMS
Why focus on this transition, you might wonder? Moving from MMA (Microsoft Monitoring Agent) and OMS (Operations Management Suite) to AMA isn't just about staying current with Azure's offerings. It's about tapping into improved security, efficiency, and the fresh features that AMA offers. Microsoft's decision to retire MMA and OMS is a strategic step towards enhancing and simplifying the monitoring experience for infrastructure.
Alright, diving into the basics, let's start with a simple query to quickly take a snapshot of our environment using the Heartbeat table on the Log Analytics. If we're looking to identify agents that have been installed or reported today, we can extend our query like this:
// Identify agents that have reported today only for MMA or OMS
Heartbeat
| where Category == "Direct Agent"
| summarize Count = count() by Computer
| count
The above query will give us a count of agents that have reported to the Log Analytics Workspace, which is a solid starting point for judging how many agents are still using MMA or OMS. If your organization is leveraging Enterprise Scale or Cloud Adoption Framework, you might be using Azure Policy to ensure monitoring agents are installed - but if you're uncertain, the above query may not be entirely helpful. This is because there could be Virtual Machines not reporting to the Log Analytics Workspace. Therefore, if you're only looking at the Log Analytics Workspace, you're only seeing the agents that have reported. To get a big picture, we need to extend our query to include all virtual machines within your subscription or tenant, not just those that have reported.
For this reason, we need to turn to the Azure Resource Graph (ARG) to get a full list of virtual machines, and then we can compare this list with the agents that have reported to the Log Analytics Workspace. This approach will give us a complete overview of all virtual machines and the agents that have checked in.
I've previously covered using the Azure Resource Graph (ARG) for querying Azure resources, particularly focusing on network resources. However, this time our spotlight is on Virtual Machines and their associated agents. It's important to note, especially if you're employing Azure Policy or another automated method for agent installation, that VM Extension or Custom Script Extension are commonly used to install these agents. So, we will focus on the VM Extensions to help us achieve our objective.
🔍 Querying Virtual Machines
To get started, we'll use the resources table in the Azure Resource Graph to query virtual machines and their extensions. The resources table is a great starting point for querying resources in the Azure Resource Graph. We can use the resources table to query the virtual machines and their extensions, and then filter the results to find the extensions we're interested in.
resources
| where type == "microsoft.compute/virtualmachines"
| extend PowerStatus = properties.extended.instanceView.powerState.displayStatus,
    OSType = properties.storageProfile.osDisk.osType,
    IdentityType = identity.type,
    ComputerName = tolower(name)
| project ComputerName, id, location, resourceGroup, PowerStatus, OSType, IdentityType
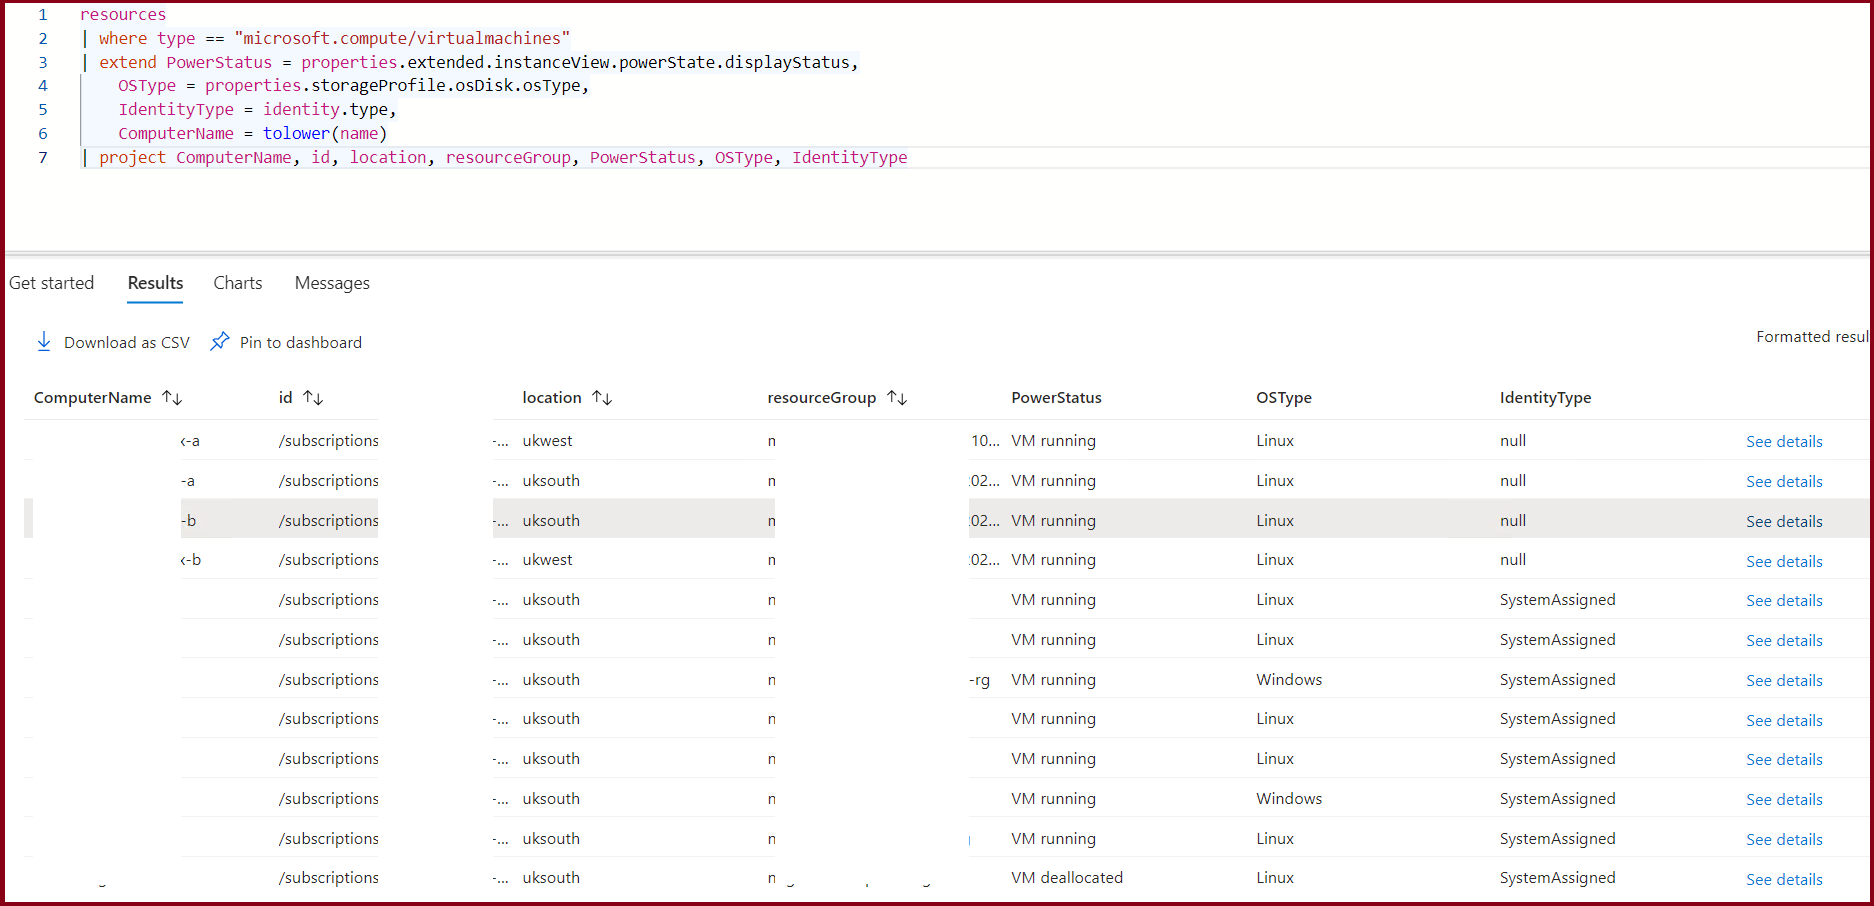
What we have here is a simple query that retrieves the virtual machines and their properties. We're interested in the ComputerName and id properties, which we'll use to join with the microsoft.compute/virtualmachines/extensions table to get the extensions installed on the virtual machines. Let's extend our query to include the extensions installed on the virtual machines.
🛰️ Extending the query to include extensions for MMA
resources
| where type == "microsoft.compute/virtualmachines"
| extend PowerStatus = properties.extended.instanceView.powerState.displayStatus,
OSType = properties.storageProfile.osDisk.osType,
IdentityType = identity.type,
ComputerName = tolower(name)
| project ComputerName, id, location, resourceGroup, PowerStatus, OSType, IdentityType
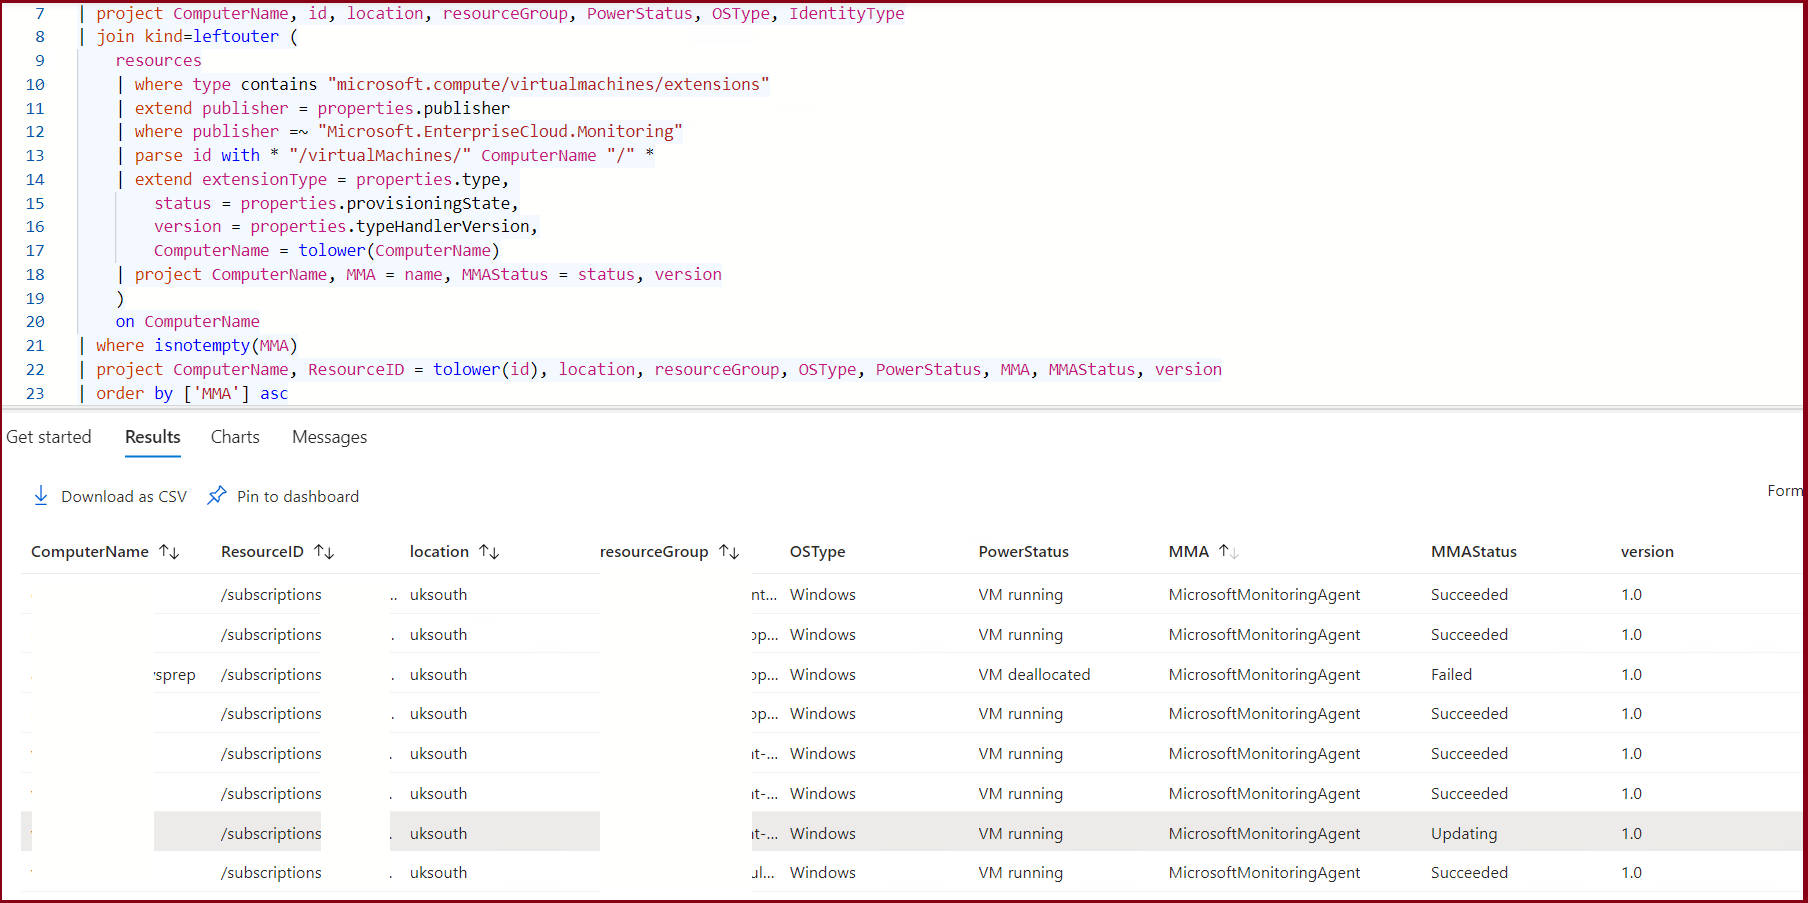
| join kind=leftouter (
resources
| where type contains "microsoft.compute/virtualmachines/extensions"
| extend publisher = properties.publisher
| where publisher =~ "Microsoft.EnterpriseCloud.Monitoring"
| parse id with * "/virtualMachines/" ComputerName "/" *
| extend extensionType = properties.type,
status = properties.provisioningState,
version = properties.typeHandlerVersion,
ComputerName = tolower(ComputerName)
| project ComputerName, MMA = name, MMAStatus = status, version
)
on ComputerName
| where isnotempty(MMA)
| project ComputerName, ResourceID = tolower(id), location, resourceGroup, OSType, PowerStatus, MMA, MMAStatus, version
The approach outlined above is effective for tracking the deployment of MMA or OMS agents across virtual machines using Azure Resource Graph, we're joining the virtualmachines/extensions table with the virtualmachines table. We're filtering the extensions to only include those with the publisher Microsoft.EnterpriseCloud.Monitoring, which is the publisher for the MMA and OMS agents. We're also parsing the id property to get the ComputerName and then projecting the properties we're interested in. This query will give us a list of virtual machines and the MMA or OMS agents installed on them. With the project keyword, we're choosing specific columns for our result set. We're focusing on essential properties like ComputerName, ResourceID, location, resourceGroup, OSType, PowerStatus, and the status of MMA. This refined selection makes the data more manageable and relevant to our needs.
The Resource Graph query that I've walked through is just the beginning - it's how we start to see which of our virtual machines are using the MMA or OMS agents. But there's more to it, and in our next post, we'll dig into these details. We'll learn and retrieve more information about the AMA Agents, So keep an eye out for our follow-up article, where we'll explore deeper and get even more from here. See you in the next part of our series!